Manure and Compost as Nutrient Sources

Using manure and compost as nutrient sources for fruit and vegetable crops

Carl J. Rosen and Peter M. Bierman

Manure is a valuable fertilizer for any farming operation and has been used for centuries to supply needed nutrients for crop growth. The use of manure has generally declined on many farms over the past 50 years due to: 1) Farm specialization with increasing separation of crop and livestock production, 2) Cost of transporting manure, which is a bulky, relatively low analysis nutrient source, and 3) Increased availability of high analysis synthetic fertilizers that usually provide a cheaper source per unit of nutrient than manure. Despite these limitations, manure (and other organic nutrient sources) produced on or near a vegetable farm provide many benefits and should be beneficially utilized whenever possible.

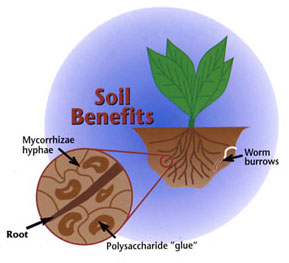
Manure and compost not only supply many nutrients for crop production, including micronutrients, but they are also valuable sources of organic matter. Increasing soil organic matter improves soil structure or tilth, increases the water-holding capacity of coarse-textured sandy soils, improves drainage in fine-textured clay soils, provides a source of slow release nutrients, reduces wind and water erosion, and promotes growth of earthworms and other beneficial soil organisms. Most vegetable crops return small amounts of crop residue to the soil, so manure, compost, and other organic amendments help maintain soil organic matter levels.

Proper use of manure and compost is essential from both a production and environmental standpoint. Applying rates that are too low can lead to nutrient deficiency and low yields. On the other hand, too high a rate can lead to nitrate leaching, phosphorus runoff, accelerated eutrophication of lakes, and excessive vegetative growth of some crops. Thus, understanding how to manage manure is important for any farming operation with livestock that relies on manure as a major source of nutrients, as well as for vegetable producers who have access to an economical supply of manure, compost, or other organic nutrient sources.

This discussion addresses differences between the composition of fresh and composted manure, nutrient availability from manure/compost, and calculation of how much manure/compost to apply. Although focused on manure or composted manure, much of the discussion and the methods for calculating rates are generally applicable to effective use of different types of compost, biosolids, and similar organic nutrient sources.

Nutrient Composition of Manure and Compost

Many different types of manure are available for crop production. For this discussion, it is assumed that most vegetable growers will be using solid manure with or without bedding. Similar principles will apply to the use of liquid manures. The nutrient content of manures varies with animal, bedding, storage, and processing. The approximate nutrient composition of various solid manures, including some composted manures, is presented in Table 1. While this table provides a general analysis of manure or compost nutrient content, it is strongly recommended that if routine applications are made for crop production the specific manure being used should be tested by a laboratory for moisture and nutrient content. Nutrient analysis should include: total nitrogen (N), ammonium-N, phosphate (P2O5), and potash (K2O). Accurate manure or compost analysis requires that a representative sample be submitted; so several subsamples should be collected and composited to make up the sample. If manure or compost is being purchased, request a nutrient analysis from the seller for N, P2O5, and K2O content.

Fresh vs. composted manure. Fresh, non-composted manure will generally have a higher N content than composted manure (Table 1). However, the use of composted manure will contribute more to the organic matter content of the soil. Fresh manure is high in soluble forms of N, which can lead to salt build-up and leaching losses if over applied. Fresh manure may contain high amounts of viable weed seeds, which can lead to weed problems. In addition, various pathogens such as E. coli may be present in fresh manure and can cause illness to individuals eating fresh produce unless proper precautions are taken. Apply and incorporate raw manure in fields where crops are intended for human consumption at least three months before the crop will be harvested. Allow four months between application and harvest of root and leaf crops that come in contact with the soil. Do not surface apply raw manure under orchard trees where fallen fruit will be harvested.

Heat generated during the composting process will kill most weed seeds and pathogens, provided temperatures are maintained at or above 131°F for 15 days or more (and the compost is turned so that all material is exposed to this temperature for a minimum of 3 days). The microbially mediated composting process will lower the amount of soluble N forms by stabilizing the N in larger organic, humus-like compounds. A disadvantage of composting is that some of the ammonia-N will be lost as a gas. Compost alone also may not be able to supply adequate available nutrients, particularly N, during rapid growth phases of crops with high nutrient demands. Composted manure is usually more expensive than fresh or partially aged manure.

Heat-dried manure/compost. Drying manure or compost to low moisture content reduces their volume and weight, which lowers transportation costs, but it also requires energy inputs. Dried products can be easier to handle and apply uniformly to fields, especially those that have been processed into pellets. Heat drying also reduces pathogens if temperatures exceed 150 to 175°F for at least one hour and water content is reduced to 10 to 12% or less. The significant energy costs to heat-dry manure or compost at high temperatures are in contrast to the self-heating generated by microbial respiration during the composting process. Heat-dried composts vary widely in the degree to which they are composted before drying. Many are only partially composted and have higher amounts of soluble (inorganic) N forms than mature, stable compost. This readily available N gives these products some characteristics that are similar to soluble N fertilizers, such as ammonium nitrate. Heat drying of manure and immature compost may increase volatilization of ammonia-N and reduce the total N content of the finished product. In addition, composted or partially composted material that is dried at high temperature rather than going through a curing phase at ambient temperatures is not as biologically active as mature compost. The disease suppressive properties of some composts depends upon recolonization of the compost by disease suppressing organisms during the curing phase.

Nutrient Availability from Manure and Compost

The analysis of manure or compost provides total nutrient content, but availability of the nutrients for plant growth will depend on their breakdown and release from the organic components. Generally, 70 to 80% of the phosphorus (P) and 80 to 90% of the potassium (K) will be available from manure the first year after application. Numbers from a table or from an analysis report should to be multiplied by these factors to obtain the amount of P2O5 and K2O available to crops from a manure or compost application.

Calculating N availability is more complex than determining P and K availability. Most of the N in manure is in the organic form and essentially all of the N in compost is organic. Organic N is unavailable for uptake until microorganisms degrade the organic compounds that contain it. A smaller fraction of the N in manure is in the ammonium/ammonia or inorganic form. The ammonium-N form is a readily available fraction. Other inorganic forms such as nitrate and nitrite can also exist, but their quantities are usually very low. Estimated levels of ammonium-N and total N in fresh and composted manure are shown in Table 1.

When applied to soil, manure, compost, and other organic amendments undergo microbial transformations that release plant-available N over time. Volatilization, denitrification, and leaching result in N losses from the soil that reduce the amount of N that can be used by crops.

The steps of N transformation in manure, compost, and other organic amendments, and the plant-available N forms, are as follows:

Table 1. Approximate Nutrient Composition of Various Types of Animal Manure and Compost
(all values are on a fresh weight basis).

Manure Type

Dry Matter

Ammonium-N

Total N

P2O5

K2O


%

————————- lb/ton —————————

Swine, no bedding

18

6

10

9

8

Swine, with bedding

18

5

6

7

7

Beef, no bedding

52

7

21

14

23

Beef, with bedding

50

8

21

18

26

Dairy, no bedding

18

4

9

4

10

Dairy, with bedding

21

5

9

4

10

Sheep, no bedding

28

5

18

11

26

Sheep, with bedding

28

5

14

9

25

Poultry, no litter

45

26

33

48

34

Poultry, with litter

75

36

56

45

34

Turkey, no litter

22

17

27

20

17

Turkey, with litter

29

13

20

16

13

Horse, with bedding

46

4

14

4

14

Poultry compost

45

1

17

39

23

Dairy compost

45

<1

12

12

26

Mixed compost: Dairy/Swine/Poultry

43

<1

11

11

10

aTotal N = Ammonium-N plus organic N

Sources: Livestock Waste Facilities Handbook, 2nd ed., 1985, Midwest Plan Service; Organic Soil Amendments and Fertilizers, 1992, Univ. of Calif. #21505.

Table 2 provides estimates of N availability from manure the first growing season after application. The actual amount available is dependent on manure type, bedding, and whether the manure has been composted. Usually 25 to 50% of the organic-N in fresh manure is available the first year. In addition to the organic fraction, N availability from manure also has to take into account the amount of ammonium-N present. This form of N is readily available for plant uptake, but is prone to losses as ammonia if not incorporated within 12 hours after application. Assuming direct manure incorporation after application, 45 to 75% of the total N (organic-N + ammonium-N) is available the first year. Note that for composted manure, the percentage of the organic N available in the first year following application is much lower than it is for fresh manure. Because there is very little ammonium-N in composted manure, the organic N fraction is basically the same as the total N fraction.

Bedding or litter will usually decrease nutrient content by dilution. If materials high in carbon (C) like straw or wood shavings are used as bedding, N availability may be reduced by the larger C/N ratio of the product. High C relative to N will lead to a tie-up of N, potentially causing N deficiency in the crop. A C/N ratio of 25/1 or greater will lead to N tie-up in the soil. A C/N ratio of less than 25/1 will release N to the crop. The C/N ratio is also an important consideration in the use of various composts, as well as a controlling factor in the composting process itself.

Table 2. Estimated Organic N Availability (Km) from Manure and Composted Manure the First Season After Application.

MANURE TYPE

Organic N


(% available)

Swine, fresh

50

Beef, no bedding

35

Beef, with bedding

25

Dairy, no bedding

35

Dairy, with bedding

25

Sheep, solid

25

Poultry, no litter

50

Poultry, with litter

45

Horse, with bedding

20

Composted poultry

30

Composted dairy

14

Manure and Compost Application

As discussed above, some of the N in fresh manure will be lost to the atmosphere during application in the form of ammonia gas. The higher the ammonium-N fraction is in manure, the more prone it is to ammonia volatilization. Manure should be incorporated within 12 hours of application to avoid excessive ammonia losses. Unincorporated manure will supply the organic N fraction and at most 20% of the ammonium-N fraction. Incorporation of composted manure is not as critical, because the N is stabilized in organic compounds with little free ammonium present. However, in order to obtain full benefit from compost, incorporation is recommended whenever possible. Manure and compost are often high in soluble salts, so to avoid salt injury seeding operations should take place about 3 to 4 weeks after application.

Residual Nutrients in Soil from Manure and Compost Application

The residual effects of the manure and compost are important. Some benefit will be obtained in the second and third years following application. When manure and compost are used to fertilize crops, soil organic matter will increase over time and subsequent rates of application can generally be reduced because of increased nutrient cycling. Continuous use of manure or compost can lead to high levels of residual N, P, and other nutrients, which can potentially be transported to lakes and streams in runoff or leach and pollute the groundwater. Taking into account residual release of N in subsequent years should help to avoid excessive applications. General rules of thumb for N are that organic N released during the second and third cropping years after initial application will be 50% and 25%, respectively, of that mineralized during the first cropping season. Remember that some manures and composts contain high levels of P, so if organic nutrient sources are regularly applied at rates to meet crop N demands, the amount of P in the soil can build up to excessively high levels. Use of soil tests, plant tissue tests, and monitoring of crop growth will help in determining the amount of residual N and other nutrients in the soil and the need for further applications.

Calculating the Amount of Manure or Compost to Apply

Methods for calculating the amount of manure or compost to apply have been adapted and summarized from Livestock Waste Facilities Handbook, 2nd ed., 1985, Midwest Plan Service. Composts can be thought of as similar to manure, but with little or no ammonium-N present. The amount of compost required to meet crop nutrient demands can be very large. For these situations, more readily available nutrients from other sources may be required to supplement compost additions, especially early in the growing season.

Use the following steps to determine the manure or compost rate needed for a particular crop:

Step 1
  • Determine the nutrient needs of the crop – Base nutrient needs on soil test recommendations.
Step 2
  • Determine the total nutrient content of the manure or compost – Chemical analysis of the actual product is strongly recommended; a general estimate can be obtained from Table 1 above.
Step 3
  • Determine the available nutrient content– Use 80% availability for P2O5 and 90% availability for K2O. Calculate N availability using the following equation:
Available N = (Organic N x Km) + Ammonium-N*
Where:

  • Organic N = Total N – Ammonium-N (lb/ton) (from manure or compost analysis or Table 1)
  • Km = Fraction of organic N released (% available/100, from Table 2)
  • Ammonium-N* = Ammonium-N in lb/ton (from manure analysis or Table 1)
*Note: if manure is not incorporated within 12 hours after application, reduce the value for ammonium-N using Table 3 to account for volatilization losses; reduce ammonium-N in the Available N equation, but use the full value in the equation for Organic N
Table 3. Percent of the Ammonium-N Available to a Crop When the Time Between Application and Incorporation Is More Than 12 Hours.

Days Until Incorporation

% of Ammonium-N Available to Crop

0.5-2

80

2-4

60

4-7

40

>7

20

Step 4
  • Calculate the rates of application needed to supply the recommended amounts of N, P2O5, and K2O – Divide the recommended nutrient needs from Step 1 by the pounds of available nutrients per ton of manure or compost determined in Step 3.
Step 5
  • Select the rate of manure or compost to apply– Frequently, manure and compost application rates are based on the N need of the crop. If manure or compost is applied on a regular basis, you may need to base rates on P to avoid excessive buildup of P in the soil, and supplement with other N sources to meet the total crop N requirement. For legumes, either P2O5 or K2O can be used as a basis for rates, depending on crop needs and soil test levels.
Step 6
  • Determine the amount of available nutrients applied with the manure or compost – multiply the application rate of manure or compost determined in Step 5 (in tons/A) times the estimated available nutrients (in lb/ton) determined in Step 3. The amounts calculated can be compared with crop needs (from Step 1) to determine if supplemental nutrients are needed (next Step).
Step 7
  • Determine whether application of additional nutrients is needed–Subtract the amount of nutrients needed by the crop (based on the soil test in Step 1) from the amounts of available nutrients applied with the manure or compost (calculated in Step 6). If the number obtained for a nutrient is zero or negative, then no further application is necessary. A positive number indicates the amount of that nutrient (in lb/A) that needs to be applied from another nutrient source to meet crop demands.


Example Calculation

The following steps provide an example manure rate calculation for the following situation:

  • Crop – sweet corn
  • Nutrient source – turkey manure with litter
  • Soil test results
    • pH = 6.3
    • Organic matter = 4.8%
    • Available P (Bray-P1) = 8 ppm
    • Available K = 70 ppm

Step 1 – Determine the nutrient needs of the crop

Step 2 – Determine the total nutrient content of the manure

  • Chemical analysis of the manure is strongly recommended for efficient nutrient use
  • For this example, we will use the general estimates in Table 1 (all values on a wet weight basis)
    • Ammonium-N – 13 lb/ton
    • Total N – 20 lb/ton
    • P2O5 – 16 lb/ton
    • K2O – 13 lb/ton


Step 3 – Determine the available nutrient content

    • We will calculate available N first
    • The equation is: Available N = (Organic N x Km) + Ammonium-N
      • Organic N = Total N – Ammonium-N, so Organic N = 20 – 13 = 7 lb/ton
      • Km = Fraction of organic N released the first season after application; get the percentage available from Table 2 and then convert to a decimal fraction, so Km = % available/100 = 0.45
      • Substituting into the original equation: Available N = (Organic N x Km) + Ammonium-N, so Available N = (7 x 0.45) + 13* = 16.2 lb/ton

*Note: we are assuming the manure is incorporated within 12 hours after application; if it is more than 12 hours before incorporation, reduce the value for ammonium-N using Table 3; reduce ammonium-N in the Available N equation, but use the full value in the equation for Organic N

  • Next we can calculate available P2O5
    • Using the 80% availability factor (from Step 3 above) the equation is:

Available P2O5 = 0.80 x Total P2O5

    • Available P2O5= 0.80 x 16 = 12.8 lb/ton
  • Finally, we can calculate available K2O
    • Using the 90% availability factor (from Step 3 above) the equation is:

Available K2O = 0.90 x Total K2O

    • Available K2= 0.90 x 13 = 11.7 lb/ton


Step 4 – Calculate the rates of application needed to supply the recommended amounts of N, P2O5, and K2O

  • Divide the nutrient recommendations (from Step 1) by the pounds of available nutrient per ton of manure (calculated in Step 3)
  • To meet the N requirement
    • 120 lb N/A divided by 16.2 lb available N/ton = 7.4 tons/A
  • To meet the P2O5 requirement
    • 60 lb P2O5/A divided by 12.8 lb available P2O5/ton = 4.7 tons/A
  • To meet the K2O requirement
    • 100 lb K2O /A divided by 11.7 lb available K2O /ton = 8.5 tons/A

Step 5 – Select the rate of manure to apply

  • Decide whether to base the application rate on the N, P2O5, or K2O requirement
  • For this example, we will use the N requirement
    • The application rate will be 7.4 tons of manure/A

Step 6 – Determine the amount of available nutrients applied with the manure

  • Multiply the application rate of manure (selected in Step 5) times the amounts of available nutrients (calculated in Step 3)
  • We decided to meet the N requirement and are applying 120 lb N/A
  • P2O5 application rate
    • 7.4 tons of manure/A x 12.8 lb available P2O5/ton = 94.7 lb P2O5/A
  • K2O application rate
    • 7.4 tons of manure/A x 11.7 lb available K2O /ton = 86.6 lb K2O /A

Step 7 – Determine whether application of additional nutrients is needed

  • Subtract the amounts of nutrients needed by the crop (based on soil test in Step 1) from the amounts of available nutrients applied with the manure (calculated in Step 6)
  • The N requirement is met
  • P2O5 requirement
    • 60 – 94.7 = – 34.7
    • Excess of 34.7 lb P2O5/A
    • This field has a medium soil test P level ( 8 ppm Bray-P1) , so a single application of excess P should not cause a problem; however, continued manure applications based on crop N requirements will build up soil test P to levels that eventually could cause water quality problems
  • K2O requirement
    • 100 – 86.6 = 13.4
    • Shortage of 13.4 lb K2O/A
    • Supplemental K2O could be applied in starter fertilizer

Related Images:

Gibberellic acid in plants

Plant Signal Behav. 2013 Sep 1; 8(9): e25504.

Published online 2013 Jun 28. doi:  10.4161/psb.25504
PMCID: PMC4002599
 

Gibberellic acid in plant

Still a mystery unresolved


Abstract

Gibberellic acid (GA), a plant hormone stimulating plant growth and development, is a tetracyclic di-terpenoid compound. GAs stimulate seed germination, trigger transitions from meristem to shoot growth, juvenile to adult leaf stage, vegetative to flowering, determines sex expression and grain development along with an interaction of different environmental factors viz., light, temperature and water. The major site of bioactive GA is stamens that influence male flower production and pedicel growth. However, this opens up the question of how female flowers regulate growth and development, since regulatory mechanisms/organs other than those in male flowers are mandatory. Although GAs are thought to act occasionally like paracrine signals do, it is still a mystery to understand the GA biosynthesis and its movement. It has not yet confirmed the appropriate site of bioactive GA in plants or which tissues targeted by bioactive GAs to initiate their action. Presently, it is a great challenge for scientific community to understand the appropriate mechanism of GA movement in plant’s growth, floral development, sex expression, grain development and seed germination. The appropriate elucidation of GA transport mechanism is essential for the survival of plant species and successful crop production.

History and Evolution

Gibberellins commonly known as gibberellic acids first came to the attention of western scientists in 1950s, they had been discovered much earlier in Japan. Rice farmers of Japan had long known of a fungal disease called foolish seedling or bakanae disease in Japanese that causes rice plants to grow taller and eliminated seed production. Plant pathologists found that these symptoms in rice plant were induced by a chemical secreted by a pathogenic fungus, Gibberella fujikuroi. Culturing this fungus in the laboratory and analyzing the culture filtrate enabled Japanese scientists in the 1930s to obtain impure crystal of two fungal “compounds” possessing plant growth promoting activity. One of these, because it was isolated from the fungus Gibberella, was named gibberellin A. In 1950s scientists of Tokyo University separated and characterized 3 different gibberellins from gibberellin A sample, and named them gibberellin A1, gibberellin A2 and gibberellin A3. The numbering system for gibberellins used in the past 50 y builds on this initial nomenclature of gibberellins A1 (GA1), GA2, and GA3.

In the same year, 2 research groups, one at Imperial Chemical Industries in Britain and other at the US Department of Agriculture (USDA) in Illinois, elucidated the chemical structure of the compound that they had purified from Gibberella culture filtration and named gibberellic acid. This compound was later shown to be identical to the gibberellin isolated by the Japanese scientist. For this GA3 is also referred to as gibberellic acid. GA3 is the principal component in Gibberella culture. The GA3 is the most frequently produced GA in commercial industrial scale fermentations of Gibberella for agronomic, horticultural and other scientific uses. Identification of a GA from a plant extract was first made in 1958 with the discovery of GA1 from immature seeds of vuner bean (Phaseolus cocineus). As more and more GAs from Gibberella and different plant sources were characterized, a scheme was adopted in 1968 to number them (GA1–GA4), in chronological order of their discovery.

Gibberellin Biosynthesis

Gibberellins (GAs) are endogenous plant growth regulators, having tetracyclic, diterpenoid compounds. After valuable efforts to understand the GA biosynthesis and movements, the appropriate site of bioactive GA in plants or tissues targeted by bioactive GAs to initiate their action has not yet been confirmed. Dwarf plant bioassay and its quantitative analysis revealed the presence of GA in active growing tissues i.e., shoot apices, young leaves and flowers. In contrast, there are some reports for the presence of GAs in xylem and phloem exudates, indicating a long-distance transport of Gas.4,5 The transport of active GAs and their intermediates was supported by grafting experiments. The contradictory results obtained from different experiments could not pin-point the site of synthesis of bioactive GA. Gibberellins being synthesized via the terpenoid pathway, require 3 enzymes viz., terpene synthase (TPSs), cytochrome P450 monooxygenase (P450s) and 2-oxoglutarate dependent dehydrogenase (2 ODDs), for the biosynthesis of bioactive GA from GGDP in plants (Fig. 1). Two terpene synthase, ent-copalyl diphosphate synthase (CPS) and ent-kaurene synthase (KS), located in plastids, involved in conversion of GGDP to tetracyclic hydrocarbon intermediate ent-kaurene (Fig. 1). ent-Kaurene is then converted to GA12 by 2 P450s. First, ent-Kaurene oxidase (KO) present in the outer membrane of plastid, catalyzes the sequential oxidation on C-19 to produce ent-kaurenoic acid. Second, ent kaurenoic acid oxidase (KAO) present in endoplasmic reticulum is subsequently converted to GA12. Bioactive GA4 is converted from GA12 through oxidations on C-20 and C-3 by GA 20-oxidase (GA20ox) and GA 3-oxidase (GA3ox), respectively (Fig. 1).

figure psb-8-e25504-g1

Figure 1. Gibberellins biosynthesis pathway; residing in 3 different cellular compartments (plastid, endoplasmic reticulum and cytoplasm). GGDP, geranylgeranyl diphosphate; ent-CDP, ent-copalyl diphosphate; CPS, ent-copalyl diphosphate synthase;


GA Signaling in Dormancy and Seed Germination

Seed contains embryo that is arrested to develop in to plant with appropriate environmental conditions to continue their life cycles. Breaking of seed dormancy to germination is controlled by some physical factors (light, temperature and moisture) and by the endogenous growth regulating hormones (GA and ABA). GA stimulates the seed germination whereas, ABA is involved in the establishment and maintenance of dormancy. GA exerts its influence in two manners, first by increasing the growth potential of embryo and second by inducing hydrolytic enzymes. During seed germination embryonic GA is released that triggers the weakness of seed cover by stimulating gene expression involved in cell expansion and modification as reported in Arabidopsis. GAs represent a natural regulator of the processes involved in seed germination to stimulate the production of hydrolytic enzyme i.e., ά-amylase, in the aleuron layer of germinating cereal grains. Cereal grains can be divided into 3 parts i.e., embryo, endosperm and seed coat. The endosperm is composed of the aleuron layer and centrally located starchy endosperm. The starchy endosperm, typically non-living at maturity, consists of thin walled cells with starch grains surrounded by aleuron layer, having thick cell wall with protein bodies. As consequences, the stored food reserves of the starchy endosperms are broken down into soluble sugars, amino acids, and other products that are transported to the growing embryo. GA biosynthetic enzymes, GA 20-oxidase and GA 3-oxidase genes show tissue and cell specific patterns of expression in germinating grain of rice, although this expression is confined to the epithelium and developing short tissues of germinating embryo. The embryo seems to be a site of GA biosynthesis and response, whereas aleurone layer shows site of response only. The response is not same in both the locations. In the aleurone, synthesis of ά-amylose takes place, whereas in developing shoot cell division/elongation. The expression of α-amylase gene is upregulated by exogenous GA, mediated through SLN1 and GAMYB transcription factors. On the other hand, PKABA1, an ABA-responsive serine/threonine protein kinase, inhibits gene expression in barley. GA not only restricts to the secretion of hydrolytic enzymes but, trigger the programmed cell death, combining with reactive oxygen species. The aleuron gene expression pattern has identified many new genes whose regulation is up/downregulated by GA and ABA treatment in barley. Mutation in a gene encoding a heterotrimeric GA protein impairs GA signaling in aleurone cells causes dwarf phenotype in rice. Radical emergence requires breaking the endosperm caps, a major physical restraint to germination in tomato and tobacco. The GA-deficient-1 (gib-1) mutant of tomato and Arabidopsis ga1–3 mutant could not germinate without exogenous GA application, however it germinated when endosperm caps were removed. GA plays an important role in the endosperm cap weakening. The bioactive GAs are produced in embryo and transported to aleurone layer, 27and trigger the expression of ά-amylase was confirmed after physiological and biochemical characterization. It is concluded that during seed germination the aleurone layer is unable to synthesize GA but perceive the GA signals.

GA Biosynthesis and Signaling in the Apical Meristem

Physiological studies and phenotypic characterization of mutants with impaired GA biosynthesis revealed that GA plays an important role in internode elongation. It stimulates cell division and expansion in response to light or dark (photomorphogenesis and skotomorphogenesis). Despite complexity, the GA biosynthetic pathway has been well characterized. It is very difficult to determine precisely the site of bioactive GA biosynthesis in plants. Very little is known about level of GA in plants and still much remain to understand the signal transduction pathways leading to elongation of stems and leaves with response to different environmental factors. Various studies on gene expression and characterization of GA deficient mutants revealed GA signaling and bioactive sites in plants. A model proposed by Sakamoto depicted relationship between GA biosynthesis and cell fate determination at the apical region of tobacco shoot. A KNOTTED1-like homeobox (KNOX) protein, NTH15 is present at the corpus region of the shoot apical meristem (SAM). An interaction with the cis-acting element results a negative regulation of the GA 20-oxidase gene. When NTH15 expression is controlled, GA biosynthesis starts and finally stimulates cell division and determines cell fate. In rice, the expression of GA related genes is restricted to the basal and peripheral region of the SAM rather than corpus region. In rice corpus region of SAM expressed OSHI and KNOX type homeobox genes to determine cell fate. Another report also revealed the expression of GA regulated genes in growing tisuues of Arabidopsis. GA promotes cell elongation through releasing DELLA mediated inhibition of BZR1 transcription factor.

GA in the Flowering and Sex Expression

GAs regulates flower initiation and its development and it is essential for male and female fertility not for differentiation of floral organs. GA-deficient mutants in Arabidopsis and tomato showed abnormal stamen development, while extreme GA deficiency revealed female sterility. No viable pollen develops in severe GA-deficient mutants, and sepals, petals, and pistils are underdeveloped, leading in some cases even to premature abortion of the flower. Application of bioactive GAs or even of the GA precursor GA9 restores normal flower development. Arabidopsis stamens require higher GA concentration than do the other floral organs stamens offer a rich source for GAs, as has been demonstrated in rice. Moreover, for a long time it has been known that in Glechoma hederacea, stamen-derived GAs stimulate corolla growth. Griffiths found that not only the stamen and petal development and arrested and the pistil length reduced, but also reduced the pedical elongation in triple GID1 receptor mutants of Arabidopsis. Further, Hu et al. identified stamens and/or flower receptacles as 2 potential sites for bioactive GA synthesis in Arabidopsis flowers, and suggest that GAs are transported from these organs to promote petal growth. GA-deficit mutants produced short stamen, resulting shortening in filaments and compromised self-pollination. The tapetum, essential for pollen development providing nutrients, contains pollen coat and allowing dehiscence. The tapetum seems to be a major site of GA biosynthesis in developing anthers in rice and Arabidopsis. The expression of GA genes was reported in anthers only after meiosis45 and it is interesting to speculate on the extent and distance GAs are exported from anthers. GA plays very important role in pollen germination and pollen tube growth. Pollens in GA deficit mutants do not germinate unless rescued by exogenous GA. Late stamen development (filament elongation, anther dehiscence, and pollen maturation) regulated through GA in coordination with jasmonic acid, whereas the GA alone mediated early anther development.

GA in pollen itself increases (7-fold) during pollen tube growth, but this may be species specific. Pollen is a rich source of GA and its content may be 200 fold greater than that in the ovary tissue both in Petunia hybrida and Lillium. However, this level of pollen GA contributes little to total ovary GA at the time of pollination. Within hour of its germination, pollens’ GA activity decrease drastically in Petunia and Lilium. Later in germination pollen tube growth becomes slow, and this might be reflected in decrease in bioactive GAs at this time, especially in angiosperm pollen. However, too little is known about differences in the timing of these changes during pollen tube growth on GA conversion, and in native GA type. Gibberellin is also reported to control sex expression by plant growth regulators. In cucumber GA3 treatments promote the male tendency in both gyonecious and hermaphroditic lines. Self-pollination study of female cucumber lines responded to repeated GA3 treatment to such an extent that the continuous female phase could be prevented. There are indication that GA do not directly promote stamen differentiation in the embryonal floral bud but merely suppress female flower formation and that, in the lack of the latter, male flower ultimately develop. However, in bitter gourd GA3 at lower concentration promoted induction of female flowers and improved the fruit quality. The highest number of female flowers per vine was recorded in bitter gourd with 50 ppm GA3. It also stimulates the pistillate flower development in castor bean, corn and hyoscyamus.

GA in Embryo Development

Gibberellins (GAs) are important constituent to regulate the temporal organization of maturation phase in maize. Early embryogenesis in maize accumulated more bioactive GAs and the concentration decline as ABA level rises. Similar relationship between GA and ABA was reported in barley and wheat. GA and ABA being antagonistic to each other maintain the relation between vivpary and quiescence; occur at or before stage 2 of embryo development. However, the level at which gene expression is affected by GA modulation remains to be determined.

Conclusion

Seed germination, stem elongation, meristmetic tissue development and differentiation of floral organs are highly dependent on GA signaling system and mechanism. GA is required to break seed dormancy leading to its germination. Seed germination is a complex process, controlled by both physical and internal regulating factors. GA plays very important role in controlling and promoting germination in cereal grains and other crop species. It is confirmed that GA deficit mutants failed to germinate in absence of exogenous GA. However, a very small known GA signaling factors has been shown to mediate the regulation of seed germination. Physiological studies and phenotypic characterization of mutants impaired GA biosynthesis. It revealed that GA plays an important role in stem or internode elongation. It stimulates cell division and expansion in response to light or dark. GAs regulate flower initiation in some LD and biennial species and inhibit flowering of some perennials, and its development and it is essential for male and female fertility but not for the specification and differentiation of floral organs. GA3 treatment promotes the male tendency in both gyonecious and hermaphroditic lines in some species. Three major points that are involved in the GA signaling mechanism are 1) the stamen is the essential site of GA synthesis, other sites cannot replace the stamen; 2) GA20ox and GA3ox are key regulators of GA biosynthesis in the stamen and 3) short-distance movement of bioactive GA (but not of its biosynthetic precursors) from the stamen to the other floral organs and the pedicel is essential and sufficient for flower development. Thus, the stamen is the site that regulates, via bioactive GA, the male flower and the pedicel growth. However, this opens up the question of how female flowers regulate growth and development, since regulatory mechanisms/organs other than those in male flowers are mandatory. Although GAs are thought to act occasionally like paracrine signals do, but it is still a mystery to understand the exact mechanism of gibberellic acid movement/transport in plants. Presently, it is a challenge for scientific community to understand the appropriate molecular mechanism of GA movement in plant’s cell. It is still a mystery to understand the exact mechanism of gibberellic acid in plant growth, floral development, sex expression, grain development and seed germination. The appropriate elucidation of GA transport mechanism is essential for the survival of plant species and successful crop production.

Footnotes

References

1. Jones RL, Phillips ID. Organs of gibberellin synthesis in light-grown sunflower plants. Plant Physiol. 1966;41:1381–6. doi: 10.1104/pp.41.8.1381. [PMC free article] [PubMed] [Cross Ref]
2. Kobayashi M, Yamaguchi I, Murofushi N, Ota Y, Takahashi N. Fluctuation and localization of endogenous gibberellins in rice. Agric Biol Chem. 1988;52:1189–94. doi: 10.1271/bbb1961.52.1189.[Cross Ref]
3. Potts WC. Internode length in Pisum. I. The effect of the Le/le gene difference on endoge-nous gibberellin-like substances. Physiol Plant. 1982;55:323–8. doi: 10.1111/j.1399-3054.1982.tb00299.x.[Cross Ref]
4. Hoad GV. Transport of hormones in the phloem of higher plants. Plant Growth Regul. 1995;16:173–82. doi: 10.1007/BF00029538. [Cross Ref]
5. Lang A. Gibberellins: structure and metabolism. Annu Rev Plant Physiol. 1970;21:537–70. doi: 10.1146/annurev.pp.21.060170.002541. [Cross Ref]
6. Katsumi M, Foard DE, Phinney BO. Evidence for the translocation of gibberellin A3 and gibberellin-like substances in grafts between normal, dwarf1 and dwarf 5 seedlings of Zea mays L. Plant Cell Physiol. 1983;24:379–88.
7. Proebsting WM, Hedden P, Lewis MJ, Croker SJ, Proebsting LN. Gibberellin concentration and transport in genetic lines of pea : effects of grafting. Plant Physiol. 1992;100:1354–60. doi: 10.1104/pp.100.3.1354.[PMC free article] [PubMed] [Cross Ref]
8. Reid JB, Murfet IC, Potts WC. Internode length in Pisum. II. Additional information on the relationship and action of loci Le, La, Cry, Na, and Lm. J Exp Bot. 1983;34:349–64. doi: 10.1093/jxb/34.3.349.[Cross Ref]
9. Aach H, Bode H, Robinson DG, Graebe JE. ent-Kaurene synthetase is located in proplastids of meristematic shoot tissues. Planta. 1997;202:211–9. doi: 10.1007/s004250050121. [Cross Ref]
10. Sun TP, Kamiya Y. Regulation and cellular localization of ent-kaurene synthesis. Physiol Plant. 1997;101:701–8. doi: 10.1111/j.1399-3054.1997.tb01054.x. [Cross Ref]
11. Helliwell CA, Chandler PM, Poole A, Dennis ES, Peacock WJ. The CYP88A cytochrome P450, ent-kaurenoic acid oxidase, catalyzes three steps of the gibberellin biosynthesis pathway. Proc Natl Acad Sci USA. 2001;98:2065–70. doi: 10.1073/pnas.98.4.2065. a. [PMC free article] [PubMed] [Cross Ref]
12. Nelson DR, Schuler MA, Paquette SM, Werck-Reichhart D, Bak S. Comparative genomics of rice and Arabidopsis. Analysis of 727 cytochrome P450 genes and pseudogenes from a monocot and a dicot. Plant Physiol. 2004;135:756–72. doi: 10.1104/pp.104.039826. [PMC free article] [PubMed] [Cross Ref]
13. Helliwell CA, Sullivan JA, Mould RM, Gray JC, Peacock WJ, Dennis ES. A plastid envelope location of Arabidopsis ent-kaurene oxidase links the plastid and endoplasmic reticulum steps of the gibberellin biosynthesis pathway. Plant J. 2001;28:201–8. doi: 10.1046/j.1365-313X.2001.01150.x. b. [PubMed][Cross Ref]
14. Bewley JD. Seed Germination and Dormancy. Plant Cell. 1997;9:1055–66. doi: 10.1105/tpc.9.7.1055.[PMC free article] [PubMed] [Cross Ref]
15. Debeaujon I, Koornneef M. Gibberellin requirement for Arabidopsis seed germination is determined both by testa characteristics and embryonic abscisic acid. Plant Physiol. 2000;122:415–24. doi: 10.1104/pp.122.2.415. [PMC free article] [PubMed] [Cross Ref]
16. Ogawa M, Hanada A, Yamauchi Y, Kuwahara A, Kamiya Y, Yamaguchi S. Gibberellin biosynthesis and response during Arabidopsis seed germination. Plant Cell. 2003;15:1591–604. doi: 10.1105/tpc.011650.[PMC free article] [PubMed] [Cross Ref]
17. Kucera B, Cohn MA, Leubner-Metzger G. Plant hormone interactions during seed dormancy release and germination. Seed Sci Res. 2005;15:281–307. doi: 10.1079/SSR2005218. [Cross Ref]
18. Finch-Savage WE, Leubner-Metzger G. Seed dormancy and the control of germination. New Phytol. 2006;171:501–23. doi: 10.1111/j.1469-8137.2006.01787.x. [PubMed] [Cross Ref]
19. Finkelstein R, Reeves W, Ariizumi T, Steber C. Molecular aspects of seed dormancy. Annu Rev Plant Biol. 2008;59:387–415. doi: 10.1146/annurev.arplant.59.032607.092740. [PubMed] [Cross Ref]
20. Yamauchi Y, Ogawa M, Kuwahara A, Hanada A, Kamiya Y, Yamaguchi S. Activation of gibberellin biosynthesis and response pathways by low temperature during imbibition of Arabidopsis thaliana seeds. Plant Cell. 2004;16:367–78. doi: 10.1105/tpc.018143. [PMC free article] [PubMed] [Cross Ref]
21. Seo M, Nambara E, Choi G, Yamaguchi S. Interaction of light and hormone signals in germinating seeds. Plant Mol Biol. 2009;69:463–72. doi: 10.1007/s11103-008-9429-y. [PubMed] [Cross Ref]
22. Kaneko M, Itoh H, Inukai Y, Sakamoto T, Ueguchi-Tanaka M, Ashikari M, et al. Where do gibberellin biosynthesis and gibberellin signaling occur in rice plants? Plant J. 2003;35:104–15. doi: 10.1046/j.1365-313X.2003.01780.x. [PubMed] [Cross Ref]
23. Gubler F, Chandler PM, White RG, Llewellyn DJ, Jacobsen JV. Gibberellin signaling in barley aleurone cells. Control of SLN1 and GAMYB expression. Plant Physiol. 2002;129:191–200. doi: 10.1104/pp.010918. [PMC free article] [PubMed] [Cross Ref]
24. Gómez-Cadenas A, Zentella R, Walker-Simmons MK, Ho THD. Gibberellin/abscisic acid antagonism in barley aleurone cells: site of action of the protein kinase PKABA1 in relation to gibberellin signaling molecules. Plant Cell. 2001;13:667–79. [PMC free article] [PubMed]
25. Ueguchi-Tanaka M, Fujisawa Y, Kobayashi M, Ashikari M, Iwasaki Y, Kitano H, et al. Rice dwarf mutant d1, which is defective in the alpha subunit of the heterotrimeric G protein, affects gibberellin signal transduction. Proc Natl Acad Sci USA. 2000;97:11638–43. doi: 10.1073/pnas.97.21.11638.[PMC free article] [PubMed] [Cross Ref]
26. Groot SPC, Karssen CM. Gibberellins regulate seed germination in tomato by endosperm weakening: A study with gibberellin-deficient mutants. Planta. 1987;171:525–31. doi: 10.1007/BF00392302. [PubMed][Cross Ref]
27. Fincher GB. Molecular and cellular biology associated with endosperm mobilization in germinating cereal grains. Annu Rev Plant Physiol Plant Mol Biol. 1989;40:305–346. doi: 10.1146/annurev.pp.40.060189.001513. [Cross Ref]
28. Gubler F, Kalla R, Roberts JK, Jacobsen JV. Gibberellin-regulated expression of a myb gene in barley aleurone cells: evidence for Myb transactivation of a high-pI alpha-amylase gene promoter. Plant Cell. 1995;7:1879–91. [PMC free article] [PubMed]
29. Hooley R. Gibberellins: perception, transduction and responses. Plant Mol Biol. 1994;26:1529–55. doi: 10.1007/BF00016489. [PubMed] [Cross Ref]
30. Swain SM, Olszewski NE. Genetic analysis of gibberellin signal transduction. Plant Physiol. 1996;112:11–7. [PMC free article] [PubMed]
31. Ross JJ, Murfet IC, Reid JB. Gibberellin mutants. Physiol Plant. 1997;100:550–60. doi: 10.1111/j.1399-3054.1997.tb03060.x. [Cross Ref]
32. Alabadí D, Gallego-Bartolomé J, Orlando L, García-Cárcel L, Rubio V, Martínez C, et al. Gibberellins modulate light signaling pathways to prevent Arabidopsis seedling de-etiolation in darkness. Plant J. 2008;53:324–35. doi: 10.1111/j.1365-313X.2007.03346.x. [PubMed] [Cross Ref]
33. Feng S, Martinez C, Gusmaroli G, Wang Y, Zhou J, Wang F, et al. Coordinated regulation of Arabidopsis thaliana development by light and gibberellins. Nature. 2008;451:475–9. doi: 10.1038/nature06448. [PMC free article] [PubMed] [Cross Ref]
34. de Lucas M, Davière JM, Rodríguez-Falcón M, Pontin M, Iglesias-Pedraz JM, Lorrain S, et al. A molecular framework for light and gibberellin control of cell elongation. Nature. 2008;451:480–4. doi: 10.1038/nature06520. [PubMed] [Cross Ref]
35. Gallego-Bartolomé J, Alabadí D, Blázquez MA. DELLA-induced early transcriptional changes during etiolated development in Arabidopsis thaliana. PLoS ONE. 2011;6:e23918. doi: 10.1371/journal.pone.0023918. [PMC free article] [PubMed] [Cross Ref]
36. Hedden P, Proebsting WM. Genetic analysis of gibberellin biosynthesis. Plant Physiol. 1999;119:365–70. doi: 10.1104/pp.119.2.365. [PMC free article] [PubMed] [Cross Ref]
37. Hedden P, Phillips AL. Gibberellin metabolism: new insights revealed by the genes. Trends Plant Sci. 2000;5:523–30. doi: 10.1016/S1360-1385(00)01790-8. [PubMed] [Cross Ref]
38. Olszewski N, Sun TP, Gubler F. Gibberellin signaling: biosynthesis, catabolism, and response pathways. Plant Cell. 2002;14(Suppl):S61–80. [PMC free article] [PubMed]
39. Sakamoto T, Kamiya N, Ueguchi-Tanaka M, Iwahori S, Matsuoka M. KNOX homeodomain protein directly suppresses the expression of a gibberellin biosynthetic gene in the tobacco shoot apical meristem. Genes Dev. 2001;15:581–90. doi: 10.1101/gad.867901. [PMC free article] [PubMed] [Cross Ref]
40. Hay A, Kaur H, Phillips A, Hedden P, Hake S, Tsiantis M. The gibberellin pathway mediates KNOTTED1-type homeobox function in plants with different body plans. Curr Biol. 2002;12:1557–65. doi: 10.1016/S0960-9822(02)01125-9. [PubMed] [Cross Ref]
41. Sentoku N, Sato Y, Kurata N, Ito Y, Kitano H, Matsuoka M. Regional expression of the rice KN1-type homeobox gene family during embryo, shoot, and flower development. Plant Cell. 1999;11:1651–64.[PMC free article] [PubMed]
42. Silverstone AL, Chang C, Krol E, Sun TP. Developmental regulation of the gibberellin biosynthetic gene GA1 in Arabidopsis thaliana. Plant J. 1997;12:9–19. doi: 10.1046/j.1365-313X.1997.12010009.x. [PubMed][Cross Ref]
43. He J X, Li Q F. Mechanism of signalling crosstalk between brassinosteroids and gibberelins. Plant signalling behaviour 2013; 8:7 e 2486,
44. Griffiths J, Murase K, Rieu I, Zentella R, Zhang ZL, Powers SJ, et al. Genetic characterization and functional analysis of the GID1 gibberellin receptors in Arabidopsis. Plant Cell. 2006;18:3399–414. doi: 10.1105/tpc.106.047415. [PMC free article] [PubMed] [Cross Ref]
45. Chhun T, Aya K, Asano K, Yamamoto E, Morinaka Y, Watanabe M, et al. Gibberellin regulates pollen viability and pollen tube growth in rice. Plant Cell. 2007;19:3876–88. doi: 10.1105/tpc.107.054759.[PMC free article] [PubMed] [Cross Ref]
46. Hu J, Mitchum MG, Barnaby N, Ayele BT, Ogawa M, Nam E, et al. Potential sites of bioactive gibberellin production during reproductive growth in Arabidopsis. Plant Cell. 2008;20:320–36. doi: 10.1105/tpc.107.057752. [PMC free article] [PubMed] [Cross Ref]
47. Rieu I, Ruiz-Rivero O, Fernandez-Garcia N, Griffiths J, Powers SJ, Gong F, et al. The gibberellin biosynthetic genes AtGA20ox1 and AtGA20ox2 act, partially redundantly, to promote growth and development throughout the Arabidopsis life cycle. Plant J. 2008;53:488–504. doi: 10.1111/j.1365-313X.2007.03356.x. [PubMed] [Cross Ref]
48. Nester JE, Zeevaart J A D. Flower development in normal tomato and a gibberellin-deficient (ga-2) mutant. Am J Bot. 1988;75:45–55. doi: 10.2307/2443904. [Cross Ref]
49. Goto N, Pharis RP. Role of gibberellins in the development of floral organs of the gibberellin-deficient mutant, ga1-1, of Arabidopsis thaliana. Canadian Journal of Botany-Revue Canadienne De Botanique. 1999;77:944–54. doi: 10.1139/cjb-77-7-944. [Cross Ref]
50. Koornneef M, Vander Veen JH. Induction and analysis of gibberellin sensitive mutants in Arabidopsis thaliana (L.) Heynh. Theor Appl Genet. 1980;58:257–63. doi: 10.1007/BF00265176. [PubMed] [Cross Ref]
51. Hirano K, Aya K, Hobo T, Sakakibara H, Kojima M, Shim RA, et al. Comprehensive transcriptome analysis of phytohormone biosynthesis and signaling genes in microspore/pollen and tapetum of rice. Plant Cell Physiol. 2008;49:1429–50. doi: 10.1093/pcp/pcn123. [PMC free article] [PubMed] [Cross Ref]
52. Plack A. Effect of gibberellic acid on corolla size. Nature. 1958;182:610. doi: 10.1038/182610a0.[Cross Ref]
53. Cheng H, Qin LJ, Lee SC, Fu XD, Richards DE, Cao DN, et al. Gibberellin regulates Arabidopsis floral development via suppression of DELLA protein function. Development. 2004;131:1055–64. doi: 10.1242/dev.00992. [PubMed] [Cross Ref]
54. Izhaki A, Borochov A, Zamski E, Weiss D. Gibberellin regulates post-microsporogenesis processes in petunia anthers. Physiol Plant. 2002;115:442–7. doi: 10.1034/j.1399-3054.2002.1150314.x. [PubMed][Cross Ref]
55. Goldberg RB, Beals TP, Sanders PM. Anther development: basic principles and practical applications. Plant Cell. 1993;5:1217–29. [PMC free article] [PubMed]
56. Itoh H, Ueguchi-Tanaka M, Sentoku N, Kitano H, Matsuoka M, Kobayashi M. Cloning and functional analysis of two gibberellin 3 beta -hydroxylase genes that are differently expressed during the growth of rice. Proc Natl Acad Sci USA. 2001;98:8909–14. doi: 10.1073/pnas.141239398. [PMC free article] [PubMed][Cross Ref]
57. Singh DP, Jermakow AM, Swain SM. Gibberellins are required for seed development and pollen tube growth in Arabidopsis. Plant Cell. 2002;14:3133–47. doi: 10.1105/tpc.003046. [PMC free article] [PubMed][Cross Ref]
58. Song S, Qi T, Huang H, Xie D. Regulation of stamen development by coordinated action of Jasmonate, auxine and gibberellin in Aribdopsis. Molecular plant advances, 2013 online. . [PubMed]
59. Barendse GWM, Rodrigues-Pereira AJ, Berkers PA, Driessen FM. Growth hormones in pollen, styles and overies of Petunia hybrid and Lilium species. Acta Bot. Neerl. 1970;19:175–86.
60. Pharis RP, King RW. Gibberrellins and reproductive development in seed plants. Annu Rev Plant Physiol. 1985;36:517–68. doi: 10.1146/annurev.pp.36.060185.002505. [Cross Ref]
61. Fuchs E, Atsmon D, Halvey AH. Adventitious staminate flower formation in gibberrelin treated gynoecious cucumber plants. Plant Cell Physiol. 1977;18:1193–201.
62. Pimenta Lange MJ, Knop N, Lange T. Stamen-derived bioactive gibberellin is essential for male flower development of Cucurbita maxima L. J Exp Bot. 2012;63:2681–91. doi: 10.1093/jxb/err448.[PMC free article] [PubMed] [Cross Ref]
63. Galun E. Effect of gibberellic acid and naphthaleneacitic acid on sex expression and some morphological characters in the cucumber plant. Phyton. 1959;13:1–8.
64. Kubicki B. Investigation of sex determination in cucumbers (Cucumus sativus). The influence of 1-naphthalene acitic acid and gibberellin on differentiation of flowers in monoceous cucumbers. Genet.Pol. 1965;6:153–76.
65. Banarjee S, Basu PS. Hormonal regulators of flowering and fruit development: effect of GA and ethereal on fruit setting and development of Momordica charinata L. Biol Plant. 1992;34:63–70. doi: 10.1007/BF02925792. [Cross Ref]
66. Nagmani S. Studies on crop growth and sex expression in relation to hybrid seed production of bitter gourd (Momordica charinata L.) M.Sc. thesis submitted to Faculty of Post Graduate Schol, IARI, New Delhi., 2011.
67. White CN, Proebsting WM, Hedden P, Rivin CJ. Gibberellins and seed development in maize. I. Evidence that gibberellin/abscisic acid balance governs germination versus maturation pathways. Plant Physiol. 2000;122:1081–8. doi: 10.1104/pp.122.4.1081. [PMC free article] [PubMed] [Cross Ref]
68. Jacobsen JV, Pearce DW, Poole AT, Pharis RP, Mander LN. Abscisic acid, phaseic acid and gibberellin contents associated with dormancy and germination in barley. Physiol Plant. 2002;115:428–41. doi: 10.1034/j.1399-3054.2002.1150313.x. [PubMed] [Cross Ref]

Related Images:

Gibberellins (GAs) and Gibberellic acid (GA3)

Gibberellins (GAs) are plant hormones that regulate growth and influence various developmental processes, including stem elongation, germination, dormancy, flowering, sex expression, enzyme induction, and leaf and fruit senescence.

Gibberellin was first recognized in 1926 by a Japanese scientist, Eiichi Kurosawa, studying bakanae, the “foolish seedling” disease in rice. It was first isolated in 1935 by Teijiro Yabuta and Sumuki, from fungal strain (Gibberella fujikuroi) provided by Kurosawa. Yabuta named the isolate as gibberellin.

Interest in gibberellins outside Japan began after World War II. In the United States, the first research was undertaken by a unit at Camp Detrick in Maryland, via studying seedlings of the bean Vicia faba. In the United Kingdom, work on isolating new types of gibberellin was undertaken at Imperial Chemical Industries. Interest in gibberellins spread around the world as the potential for its use on various commercially important plants became more obvious. For example, research that started at the University of California, Davis in the mid-1960s led to its commercial use on Thompson seedless table grapes throughout California by 1962. A known antagonist to gibberellin is paclobutrazol (PBZ), which in turn inhibits growth and induces early fruitset as well as seedset.

Gibberellic acid (also called Gibberellin A3, GA, and GA3) is a hormone found in plants and fungi. Its chemical formula is C19H22O6. When purified, it is a white to pale-yellow solid.

However, plants produce low amounts of GA3, therefore this hormone can be produced industrially by microorganisms. Nowadays, it is produced by submerse fermentation, but this process presented low yield with high production costs and hence higher sale value. One alternative process to reduce costs of the GA3 production is Solid-State Fermentation (SSF) that allows the use of agro-industrial residues. Gibberellic acid is a simple gibberellin, a pentacyclic diterpene acid promoting growth and elongation of cells. It affects decomposition of plants and helps plants grow if used in small amounts, but eventually plants develop tolerance to it. GA stimulates the cells of germinating seeds to produce mRNA molecules that code for hydrolytic enzymes. Gibberellic acid is a very potent hormone whose natural occurrence in plants controls their development. Since GA regulates growth, applications of very low concentrations can have a profound effect while too much will have the opposite effect. It is usually used in concentrations between 0.01 and 10 mg/L.

GA was first identified in Japan in 1926, as a metabolic by product of the plant pathogen Gibberella fujikuroi (thus the name), which afflicts rice plants; fujikuroi-infected plants develop bakanae (“foolish seedling”), which causes them to grow so much taller than normal that they die from no longer being sturdy enough to support their own weight.

Gibberellins have a number of effects on plant development. They can stimulate rapid stem and root growth, induce mitotic division in the leaves of some plants, and increase seed germination rate.

Gibberellic acid is sometimes used in laboratory and greenhouse settings to trigger germination in seeds that would otherwise remain dormant. It is also widely used in the grape-growing industry as a hormone to induce the production of larger bundles and bigger grapes, especially Thompson seedless grapes. In the Okanagan and Creston valleys, it is also used as a growth replicator in the cherry industry. It is used on Clementine Mandarin oranges, which may otherwise cross-pollinate with other citrus and grow undesirable seeds. Applied directly on the blossoms as a spray, it allows for Clementines to produce a full crop of fruit without seeds.

Related Images:

How to Use Vitazyme

How to Use Vitazyme with Plumeria

Potted Plumeria and Typical Gardens

Simply use Vitazyme once a month during the growing season.  You can drench or water Vitazyme by hand at a rate of .9% (1 oz./gallon) over top of both the plumeria and the soil.  Of course keep in mind watering times, not because Vitazyme will burn a plant (it certainly won’t), but rather follow good practices to reduce mildews and enhance water conservation.

You can also apply Vitazyme with any spray tank.  We would recommend a 4% (5 oz./gallon) rate sprayed directly on the plants until run-off. Vitazyme will flow through all spray rigs, irrigation rigs including drip irrigation, and through seeders with in-furrow injection so you don’t have to worry about clogging, and have many options for applications.

A good sized garden will use less than a gallon of Vitazyme per season. Vitazyme can be stored almost indefinitely, so any leftover will be good the following season, and not wasted.

Vitazyme can tank mix with any herbicide, fungicide, pesticide or fertilizer without issue, we always recommend applying Vitazyme as part of your individual fertility/control programs. This way you will save on application costs for Vitazyme alone.  Vitazyme is flexible enough so that if the recommended timing of applications varies a bit from your typical practice, you can still use it and gain valuable results.

Generally, plumeria will use 4-5 applications over the growing season. This will be defined more specifically in the guide.  Remember, the guide is just that, a guide.  Your growing conditions will help to dictate the exact timing of applications.

Vitazyme should be used within the context of a complete crop management system, never by itself. Vitazyme will optimize your existing program by enabling your plumeria to utilize soil fertility and water more efficiently while reducing costs and increasing productivity. This product is very effective with low nitrogen. Follow this easy-to-use five-point program.

  1. If possible, analyze the soil at the USDA or a reputable laboratory and correct mineral deficiencies and imbalances with expert consultation.
  2. Treating plumeria seeds or transplant roots, if possible, at planting. Treat seeds with a diluted Vitazyme solution, such as a 5% solution (4 oz./gallon). For excellent results, dip the seeds in the solution and allow to dry. For transplanting soak for approximately 30 minutes or spray transplant roots with a or 2% solution (2.5 oz./gallon).
  3. Apply Vitazyme to the soil in Early Spring. After the initial application Vitazyme can be applied monthly. A fall application on the soil is effective to accelerate residue breakdown.
  4. Integrate other, sustainable management practices into the total program.

Application Rates

  • Seeds, Cuttings and Transplants. For faster emergence and rooting, dilute at a rate of 1 oz/19 oz of water (a 5% solution) and mist all exposed areas. Allow seeds to dry prior to planting.
  • Potted Plumeria Application. For drenching, dilute at a rate of 1 oz/99 oz of water (a 1% solution). For foliage spraying, dilute at a rate of 4 oz/gallon (a 5% solution)
  • In-Ground Plumeria (for all temperate fields). Drench or spray Foliage dilute at a rate of 4 oz/gallon (a 5% solution)
  • Soil Conditioning (for all temperate field and in-ground plumeria). Apply 4 oz/gallon (a 5% solution) before ground freezing

Tips

  • Vitazyme may be tank-mixed with fertilizers, herbicide, fungicides, and pesticides.
  • Vitazyme does not need to be tilled into the soil after application.
  • The dilution rate is not critical as long as the proper application is made.
  • Soil moisture is needed to activate Vitazyme.
  • Vitazyme can be stored almost indefinitely, so no loss of investment.

Proven Efficient

Vitazyme used with your normal, sound plumeria management practices Vitazyme will increase your yields sufficiently so that you realize a substantial increase in plumeria health and productivity.

You will find that you can reduce your nitrogen input, usually between 25% and 50%, and obtain the same or higher crop yields. Nitrogen is rising in cost and is likely to remain high in the future. Saving money on your fertilizer purchases will increase your profits when using Vitazyme.

Related Images:

Why use Bioblast

The future of Plumeria health is here.

Bioblast is more than a fertilizer 7-7-7 NPK, it’s a Plant Food & Biostimulant. Bioblast is innovation for your plumeria or other plants and is the ultimate plant food and growth activator for all your growing needs.

Introducing BioBlast an all natural organic Bio Activator with Rooting Agents Growth Activators and Vitamins B-1, B-2, and B-3. It makes your plants healthy. You can apply as a drench or as foliare.
The future of plant growth is here. Bioblast is innovation for your plants and is the ultimate plant food and growth activator for all your growing needs.

Why Bioblast?

Bioblast works with every part of your plant. Soil organisms are invigorated with Vitazyme biostimulants providing quicker, more vigorous growth. Rooting is encouraged with our Root Activator. A balanced 7-7-7 NPK provides the essentials of plant growth and structure. B-Vitamins and Zinc encourage a robust immune system, while Iron promotes chlorophyll production in the leaves. Bioblast is a great foliar feed for growing plumeria seedlings.

• PLANT FOOD
• B-VITAMINS
• ROOTING AGENT
• BIO-ACTIVATORS

Guaranteed Analysis

  • Total Nitrogen (N)…. 7.00%
    • 2.20% Ammoniacal Nitrogen
    • 4.80% Urea Nitrogen
  • Available Phosphate (P2O5)… 7.00%
  • Soluble Potash (K2O)… 7.00%
  • Sulfur (S)… 0.10%
  • Iron (Fe) 0.40%
  • Zinc (Zn) 0.03%

Application

Mix 1 Tbsp per gallon of water – or 2 capfuls if you don’t have a measure. Apply once per week or as needed. Reduce by 50% during extreme heat or for indoor plants. Safe when used as directed. Will not harm roots or leaves even in hot, dry weather.

Great for use on all types of plants, for soil improvement, or as a compost starter.


Related Images:

Why Use Vitazyme

Vitazyme is a liquid concentrate microbially synthesized from plant materials and then stabilized for long life. Powerful but natural biostimulants contained in the material greatly benefit plant growth and soil conditions to boost growth and profits for the grower.

Vitazyme is non-toxic. It is organic, safe and sustainable and has an array of active agents, including:

Known Ingredients in Vitazyme (all derived from natural materials):

Brassinosteroids 0.022mg/ml
1-triacontanol 0.33 ug/ml
Vitamin B1 (thiamin) 0.35 mg/100g
Vitamin B2 (riboflavin 0.25 mg/100g
Vitamin B6 0.15 mg/100g

Vitazyme is an all-natural liquid “biostimulant” for soil organisms and plants that contain certain biological activators, which are by-products of a proprietary fermentation process. These active agents include vitamins, enzymes, and other powerful but gentle growth stimulators such as B-vitamins, triacontanol, glycosides, and porphyrins.

Vitazyme, used within the context of a common-sense management system, will help the farmer overcome many of his production problems. While not a “magic bullet,” it helps the entire system work better.

Agriculture of today must emphasize the use of biological systems — not strictly chemical approaches — to achieve long-term soil productivity.

The product promotes soil life by conforming with natural laws, by encouraging natural predators to control insect and nematode pests, by promoting more intensive biological nitrogen fixation, and by stimulating natural rhizosphere organisms to produce needed plant growth factors.

Investigations are continuing on other components:

Likely phytoactive components which will be discovered include the following:

  • Various porphyrins (chlorophyll derivatives)
  • Various glycosides (glucose derivatives)
  • Salicylic acid or salicylates
  • Amino acids such as methionine and others
  • Nucleic acid remnants or precursors
  • Nucleotides, especially adenine but possibly others
  • Gallic acid
  • Glucuronic acid
  • Various enzymes

Benefits to Soils

Soil structure, so critical for air and water movement through the soil to facilitate root growth and nutrient uptake, is improved by Vitazyme in at least four ways:

  1. Increased root growth (more root channels).
  2. More polysaccharides to glue particles together; only 0.2% more polysaccharide can markedly improve structure.
  3. Improved mycorrhizae activity (creating sac-like structures)
  4. Greater earthworm activity, their burrows create channels for air and water. Water infiltration is increased, and runoff and erosion are consequently decreased. Compaction is reduced so roots can freely explore the soil for nutrients and water, increasing yields.

How Vitazyme benefits Plumeria

Vitazyme will increase chlorophyll first, allowing the plumeria to harness more energy from the sun. The plumeria will develop a larger and more efficient root system and working in conjunction with the microbial population in the rhizosphere will convert more nutrients from a non-uptake able form to forms that can be taken up by the plumeria. In this way, the soil system becomes more efficient and is the main reason why we say you can lower your nutrient inputs using Vitazyme. This, in part, explains the typical results of greater yield and quality measures for any crop.

  • Greater root and leaf growth
  • More and bigger blossoms
  • Improved soil conditions
  • Inexpensive, very cost-effective
  • Easy to use
  • Safe and non-toxic
  • Can be seed-applied
  • Can be tank-mixed with any liquid fertilizers, herbicides, and pesticides
  • Can run through irrigation lines without clogging
Soil Benefits

Corn Yield

Vitazyme applied through the irrigation system–drip, sprinkler, or sprayed–will accelerate growth and maturity of plumeria, in containers or in the ground. Trunk caliper will increase faster as photosynthesis and leaf areas are accelerated. Vitazyme will improve the root, leaf, and flower growth.

Treated seeds will emerge faster, and seedling growth will be more vigorous. Improved chlorophyll development will give faster nutrition, deeper green colors, and more lustrous and attractive leaves. Vitazyme will also aid in the early development of flowers.

Expect better tilth and permeability in your soil with Vitazyme use.


Vitazyme Science

Vitazyme intensifies the activity of the plant-soil system. Photosynthesis is increased, so more carbon from the air is fixed into plant tissue. Energy-rich compounds produced in the leaves by this vigorous metabolism move into the root system and out into the soil, or media where billions of bacteria, algae, fungi, protozoa, and other organisms feed on this energy. The organisms, in turn, release minerals and growth stimulants for plant uptake…a beautiful symbiosis. Plant stress is reduced, removing growth and yield limitations.

Vitazyme Stimulates Rhizosphere Symbiosis

Vitazyme contains “metabolic triggers” that stimulate the plant to photosynthesize better, fixing more sunlight energy in the form of carbon compounds to increase the transfer of carbohydrates, proteins, and other growth substances into the root zone. These active agents may enter the plant through either the leaves or the roots. Root growth and exudation are both enhanced. This enhancement activates the metabolism of the teeming population of rhizosphere organisms to a higher level, triggering a greater synthesis of growth-benefitting compounds and a faster release of mineral for plant uptake. The plant microbial symbiosis is stimulated.

Symbiotic Cycle

The Enzyme Cascade Effect

Very small amounts of these metabolic triggers in Vitazyme are needed to greatly improve plant and rhizosphere microbe response. This is because of the enzyme cascade effect. Successive tiers of enzymes are activated in plant and microbial tissues to yield a large physiological response from very little applied activator.

In short, Vitazyme enables the plant to better express its genetic potential by reducing the stresses that repress that expression.

Cascade effect

Improved Symbiosis: The Secret of Vitazyme’s Action

All plants that grow in soils develop an intimate relationship between the roots and the organisms that populate the root zone. The teeming billions of bacteria, fungi, algae, cyanobacteria, protozoa, and other organisms that grow along the root surfaces—the rhizosphere—are much more plentiful than in the bulk of the soil. This is because roots feed the organisms with dead root epidermal cells as well as compounds exuded from the roots themselves. The plant may inject up to 25% or more of its energy, fixed in the leaves as carbohydrates, amino acids, and other compounds, into the root zone to feed these organisms… for a very good purpose.

The microorganisms which feed on these exuded carbon compounds along the root surfaces benefit the plant in many ways… a beautiful symbiotic relationship.

The plant feeds the bacteria, fungi, algae, and other microbial species in the rhizosphere, which in turn secrete enzymes, organic acids, antibiotics, growth regulators, hormones, and other substrates which are absorbed by the roots and transported to the leaves. The acids help dissolve essential minerals, and reduced iron releases anionic elements.

A few important microbe groups are listed below.
Mycorrhizae Mycorrhizae, especially vascular-arbuscular (VAM) tyes, form “arbuscules” within root cortical cells and extend thread-like hyphae into the soil, increasing the root feed surface by ten times or more. They are the major means for uptake of phosphorus, copper, zinc, and other less mobile elements. They also can extract water under much drier conditions than can root plants.
Cyanobacteria Cyanobacteria fix carbon (they photosynthesize), and also fix nitrogen from the air for plant use.
Phosphate-dissolving bacteria Phosphate-dissolving bacteria excrete acids that dissolve minerals and release hard-to-get phosphorus.
Azotobacter Azotobacter species live on exudates and other carbon sources while fixing nitrogen.
Actinomycetes Actinomycetes generate a variety of pathogen-fighting antibiotics.

Related Images:

Why Use Carl Pool Root Activator

Carl Pool Root Activator is a 100% natural product which safely promotes regeneration of roots through increased elongation rates. Root Activator stimulates fast root growth, reduces transplant shock, and hastens plant establishment. Use on all newly planted or transplanted plants and soil, and any time additional root growth is desired to reach the potential of underperforming plants.

Carl Pool’s Root Activator contains 7.5% glycosides. It prevents transplant shock and stimulates fast root growth.

  • Concentrated Formula
  • Prevents Transplant Shock
  • Stimulates Fast Root Growth
  • Increases Plant Root Mass

Ingredients:

Active:

Glycosides 7.5%
Gibberellin 0.03%
3-Indoleacetic Acid 0.02%
Kinetin 0.02%

Inert: 92.43%

Description: Natural glycosides derived from pecan shells and water. Glycosides are compounds which comprise a wide array of substances that make up a significant proportion of cellular and tissue contents of plants and as a critical influence on plants in root, stem and leaf development. Beneficial flavonoids often occur as glycosides; some important as coloring agents for flowers to attract insects and birds while others promote disease resistance. Carl Pool Root Activator prevents transplanting shock and stimulates fast root growth and forking of the root system.

Application Recommendations:

  • Mix 1 pint to 5 gallons of water or 8 Tbsp. to 1 gallon of water. Saturate entire root area of a plant. Repeat every 30 days until desired results are achieved.
  • Plumeria plant in containers: Use from 1 to 5 gallons of the diluted solution around each plant depending on the size of the pot and root area.
  • Plumeria Trees in Ground: Saturate entire area within the drip line. Use from 3 – 10 gallons of the diluted solution around each tree depending on the size of trunk diameter.

Related Images:

Potassium (K)

Potassium is a chemical element with symbol K (derived from Neo-Latin kalium) and atomic number 19. Elemental potassium is a soft silvery-white alkali metal that oxidizes rapidly in air and is very reactive with water, generating sufficient heat to ignite the hydrogen emitted in the reaction and burning with a lilac flame. Naturally occurring potassium is composed of three isotopes, one of which, 40K, is radioactive. Traces (0.012%) of this isotope are found in all potassium making it the most common radioactive element in the human body and in many biological materials, as well as in common building substances such as concrete.


Because potassium and sodium are chemically very similar, their salts were not at first differentiated. The existence of multiple elements in their salts was suspected in 1702, and this was proven in 1807 when potassium and sodium were individually isolated from different salts by electrolysis. Potassium in nature occurs only in ionic salts. As such, it is found dissolved in seawater (which is 0.04% potassium by weight), and is part of many minerals.


Most industrial chemical applications of potassium employ the relatively high solubility in water of potassium compounds, such as potassium soaps. Potassium metal has only a few special applications, being replaced in most chemical reactions with sodium metal.

Related Images:

Micronutrients

Boron (B)

  • Helps in the use of nutrients and regulates other nutrients. 
  • Aids production of sugar and carbohydrates. 
  • Essential for seed and fruit development. 
  • Sources of boron are organic matter and borax

Copper (Cu)

  • Important for reproductive growth.
  • Aids in root metabolism and helps in the utilization of proteins. 

Chloride (Cl)

  • Aids plant metabolism. 
  • Chloride is found in the soil. 

Iron (Fe)

  • Essential for formation of chlorophyll.
  • Sources of iron are the soil, iron sulfate, iron

    Manganese (Mn)

Related Images:

Macronutrients

Micronutrients are those elements essential for plant growth which are needed in only very small (micro) quantities . These elements are sometimes called minor elements or trace elements, but use of the term micronutrient is encouraged by the American Society of Agronomy and the Soil Science Society of America. The micronutrients are boron (B), copper (Cu), iron (Fe), chloride (Cl), manganese (Mn), molybdenum (Mo) and zinc (Zn). Recycling organic matter such as grass clippings and tree leaves is an excellent way of providing micronutrients (as well as macronutrients) to growing plants.

Nitrogen (N)

  • Nitrogen is a part of all living cells and is a necessary part of all proteins, enzymes and metabolic processes involved in the synthesis and transfer of energy.
  • Nitrogen is a part of chlorophyll, the green pigment of the plant that is responsible for photosynthesis.
  • Helps plants with rapid growth, increasing seed and fruit production and improving the quality of leaf and forage crops.
  • Nitrogen often comes from fertilizer application and from the air (legumes get their N from the atmosphere, water or rainfall contributes very little nitrogen)

Phosphorus (P)

  • Like nitrogen, phosphorus (P) is an essential part of the process of photosynthesis.
  • Involved in the formation of all oils, sugars, starches, etc.
  • Helps with the transformation of solar energy into chemical energy; proper plant maturation; withstanding stress.
  • Effects rapid growth.
  • Encourages blooming and root growth.
  • Phosphorus often comes from fertilizer, bone meal, and superphosphate.

Potassium (K)

  • Potassium is absorbed by plants in larger amounts than any other mineral element except nitrogen and, in some cases, calcium.
  • Helps in the building of protein, photosynthesis, fruit quality and reduction of diseases.
  • Potassium is supplied to plants by soil minerals, organic materials, and fertilizer.

Calcium (Ca)

  • Calcium, an essential part of plant cell wall structure, provides for normal transport and retention of other elements as well as strength in the plant. It is also thought to counteract the effect of alkali salts and organic acids within a plant.
  • Sources of calcium are dolomitic lime, gypsum, and superphosphate.

Magnesium (Mg)

  • Magnesium is part of the chlorophyll in all green plants and essential for photosynthesis. It also helps activate many plant enzymes needed for growth.
  • Soil minerals, organic material, fertilizers, and dolomitic limestone are sources of magnesium for plants.

Sulfur (S)

  • Essential plant food for production of protein.
  • Promotes activity and development of enzymes and vitamins.
  • Helps in chlorophyll formation.
  • Improves root growth and seed production.
  • Helps with vigorous plant growth and resistance to cold.
  • Sulfur may be supplied to the soil from rainwater. It is also added in some fertilizers as an impurity, especially the lower grade fertilizers. The use of gypsum also increases soil sulfur levels.

Related Images: